30 May 2026
Volleyball Circuit Analysis Tracks Aggregated Line Variations Across Operators for Position Assembly
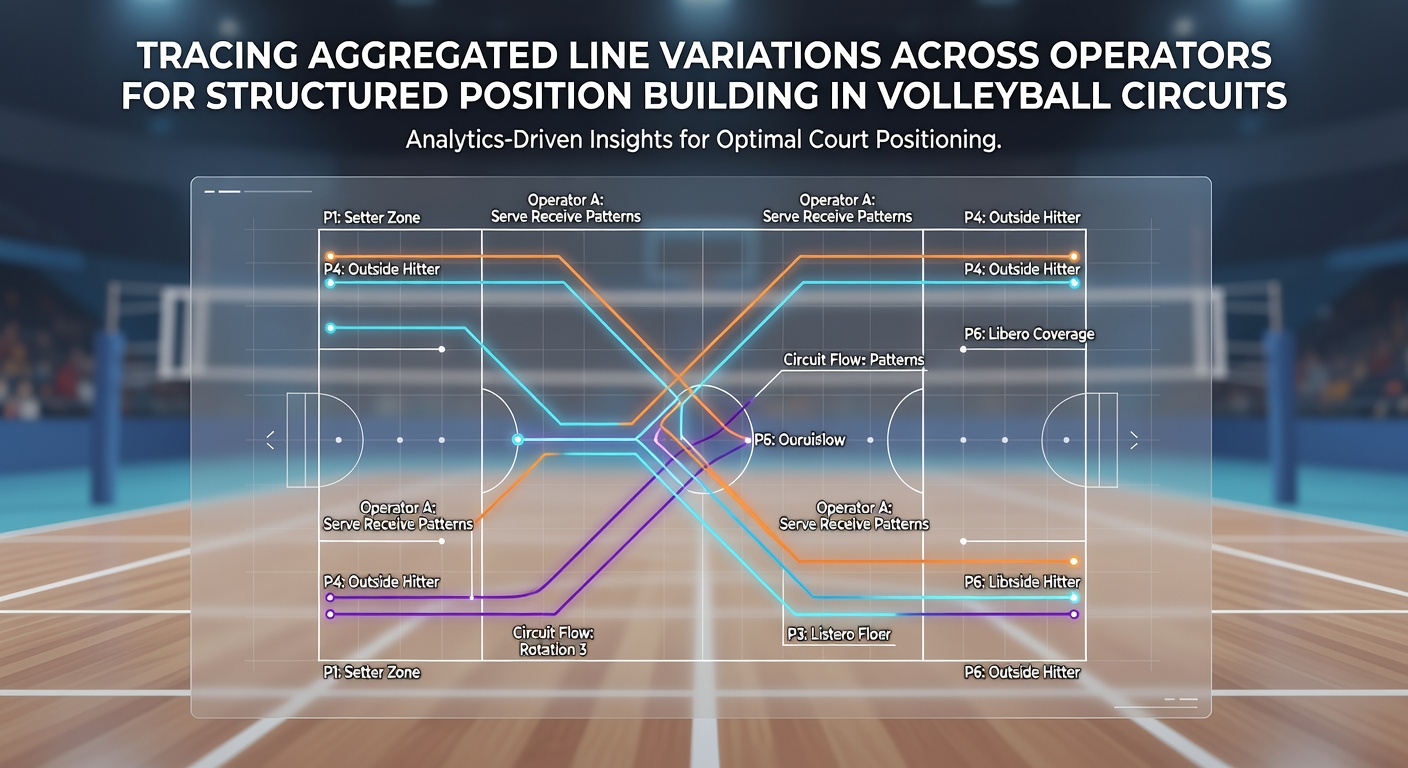
Volleyball betting markets generate continuous line movements as operators adjust spreads and totals based on team news, set outcomes, and live scoring data. Aggregating these shifts across multiple bookmakers creates datasets that identify temporary discrepancies suitable for coordinated position construction in circuits covering professional leagues and international tournaments.
Core Mechanics of Line Aggregation in Volleyball Markets
Operators publish opening lines on match totals, set handicaps, and player props hours before scheduled starts, then revise those figures as warm-up reports and injury updates circulate. Researchers at sports analytics centers compile real-time feeds from dozens of platforms, calculating average movements and outlier spreads that deviate from the consensus. Those deviations often appear when one operator reacts slower to a late roster change while others have already adjusted.
Data aggregation platforms apply statistical filters to isolate movements exceeding normal volatility thresholds. A three-point swing in the total points line across three separate operators within a ten-minute window, for example, signals potential entry points for multi-leg positions. Analysts record each instance with timestamps, stake sizing recommendations, and correlation notes that link volleyball-specific factors such as serve reception efficiency or blocking percentages to the observed line change.
Structured Position Construction Using Aggregated Signals
Position builders combine individual bets into layered structures that distribute risk across correlated outcomes. One common formation pairs an over-total bet from the operator showing the lowest line with an under-total from the operator posting the highest line, locking in a margin when the final score lands between the two figures. Additional layers incorporate set handicaps or player performance props that move in tandem with the primary total.
Circuits covering European league weekends and Asian club competitions supply overlapping match schedules that allow simultaneous monitoring of multiple games. Aggregated feeds reveal when line variations in one match influence pricing in a later fixture involving shared players or similar playing styles. Traders who maintain position matrices adjust stake allocations in real time as new discrepancies surface, maintaining overall exposure within predefined risk parameters.
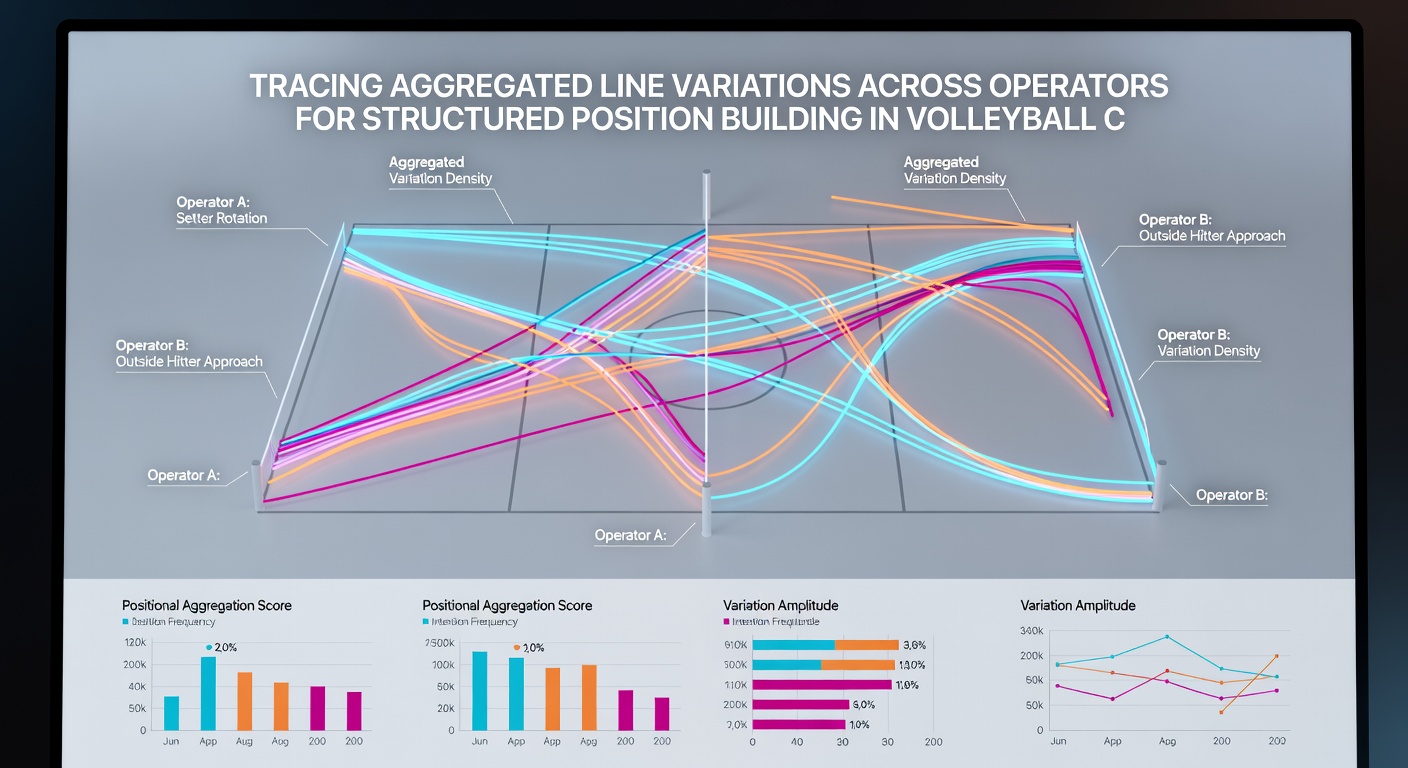
Regional Regulatory Developments Affecting Data Access
Policy changes scheduled for May 2026 in several jurisdictions will alter data licensing requirements for betting operators, requiring clearer disclosure of odds sourcing and movement histories. Industry groups such as the Responsible Gambling Council have published preparatory guidelines that encourage standardized reporting formats. These formats facilitate more consistent aggregation across borders because line data becomes comparable under uniform timestamp and revision protocols.
Operators in markets preparing for the new rules have begun publishing historical line archives that extend back twelve months, enabling researchers to test aggregation models against past volleyball tournaments. Early reviews of these archives show that set-total variations cluster most frequently during high-stakes playoff matches where injury reporting timelines compress.
Technical Infrastructure Supporting Aggregation Workflows
Modern aggregation systems ingest API streams from operator endpoints and normalize the data into unified schemas that tag each line with sport, league, market type, and revision sequence. Machine-learning classifiers then flag statistically significant outliers while suppressing noise generated by promotional pricing or low-liquidity props. Volleyball circuits benefit particularly from this filtering because set-based scoring produces discrete, high-frequency updates that translate directly into measurable line movements.
Position builders integrate these flagged signals into order-management interfaces that execute simultaneous wagers across multiple accounts. Risk-management modules calculate combined payout profiles and margin requirements before any order reaches the execution stage. Continuous reconciliation against settled results refines the underlying models so that subsequent aggregations incorporate observed accuracy rates.
Conclusion
Aggregation of line variations across operators supplies the raw material for structured position building in volleyball betting circuits. Standardized data practices scheduled to expand in May 2026 will further support consistent tracking and comparison, allowing systematic identification of discrepancies that align with match-specific variables. The resulting workflows connect real-time scoring dynamics with multi-operator pricing differences through documented, auditable processes.